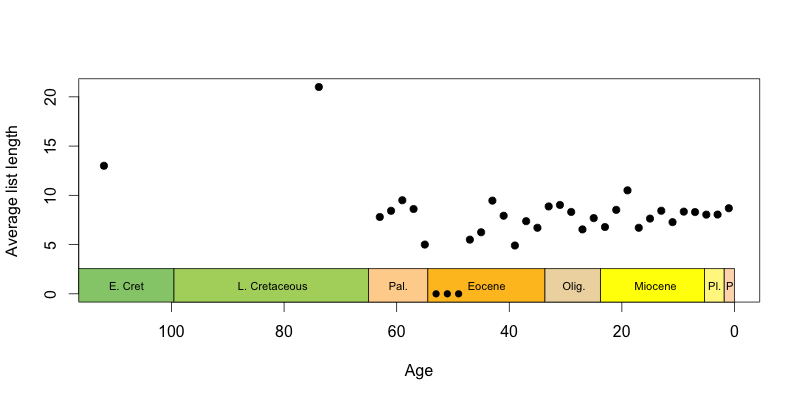
I can’t believe it’s two weeks into the March Madness month. I am trying very hard not to focus on it, but I’m half way to the deadline for my first chapter, and I don’t feel great about the rate of progress in the last week. I think being sick was just a part of it—I’m also pretty capitally stuck, and I’m not sure what how to forge ahead. The past few days haven’t been a complete write-off. I’ve had some good ideas, chief among them plotting the taxa in morphospace with the plot symbol size reflecting the proportion of occurrences that the taxon represents. This would create one more plot for the morphospace-through-time paper, if indeed I go with the division of papers Andy suggested.
This is one of the sticking points. What will go in which of the two papers? One possible layout, suggested by Andy, was to present the results more or less in the order I did them. First paper:
- General introduction of both papers
- PCO dimensionality reduction and methods for estimating variance captured by axes
- What the axes mean, and how hard it is to know that
- Comparison to NMDS
- Comparing PCO (axes 1-2) to phylogeny
- Comparing morphological to molecular distance
The second paper would then look at morphospace through time.
- Linking the PCO morphospace to Neptune—stacked 3D plot with convex hulls
- Disparity and diversity through time, under range-through
- Ditto under sampling in-bin
- Ditto under subsampling by unweighted lists
- …?
Andy’s suggestion was actually to end the first paper with the PCO through time plot, and the leave the disparity analyses for the second papers. It seems more logical to me to have all of the through-time stuff in the second paper, but maybe I’m wrong in that. Also, if I do put the first PCO-through-time plot in the first paper, what does that leave for the second paper? Just looking at disparities through time in various subsampling regimes? Hmph.
Well. That’s the first sticking point. The second sticking point is the narrative, the biological hook, the meaning of it all. At this point everything I have is sheer analysis, divorced from biological meaning or hypotheses—both at the general evolutionary theory level and at the specific level of diatoms, their ecology, and what has been written about their evolution. The past few days’ reading (half-hearted though it was) has not really helped me find direction in that regard.
The third sticking point, which is closely related to the second, is what to do about the missing characters-through-time plot. I want a plot in my paper that shows some relevant characters changing in their prevalence or occurrence through time. I gave up on the idea of plotting all characters, and instead found the characters responsible for morphospace expansion in each time bin. That didn’t lead to any clear story. So then I was hunting for biological hypotheses in the literature that might be tested by looking for particular characters (see the problems in sticking point #2). So now all that’s left to be done, besides more open-ended reading in the hope of coming across something that makes sense, is to sift through the list of characters in the morphospace and hope that something jumps out at me as relevant. Yech.
Well. So much for the main sticking points. I suppose I have a couple of clear to-dos arising:
- Generate the morphospace “density” plot.
- Look through the list of characters for ones that might be biologically interesting to plot through time.
These, unfortunately, don’t address the major to-do, which is to get the damn chapters written. Possibilities: since writing isn’t working so well, try talking through what I have, if necessary on tape or to an unsuspecting victim, and hope that some sort of narrative emerges that way. Read more. Try turning my figures into a Keynote presentation and generate a narrative (or narratives) that way. That’s something I’ll have to do sooner or later anyway.