Shareholder Quorum
ø
Another weekend away from work, and no, it doesn’t feel great. Somehow it just happened. Fuck.
Anyway. I’m trying to figure out how to implement Alroy’s SQ algorithm. On Friday, I couldn’t get his website to work (where he had posted the R code), but he replied on Saturday with the fixed link, and so I’m now sitting (at Darwin’s again) reading through his code and trying to understand how it works. I wish I could see it in action with an example data set, because I’m not entirely sure what sort of data the function actually takes (while his documentation is much better than the code junk I got from Rabosky, it still leaves much to be desired). Is it just counts of taxon occurrences? If so, i.e. if the function doesn’t identify what particular taxa are in the subsample, this is going to make the proposed exercise of subsampling the morphospace very difficult indeed. Well. It’ll require rewriting the function.
From a little bit more reading and some monkeying around with the code (i.e. loading the function in R and passing some sample data to it), I find my suspicion supported—it seems as though the function simply takes an array of numbers representing the occurrence counts of different taxa in a time bin, plus the other function parameters, and returns the average number of taxa in the appropriate sized subsample (over the requested number of trials or iterations). This does make calculating the diversity curve fairly easy, but makes it that much harder to get the morphospace to subsample.
Should I just rewrite the function for my own purposes? It doesn’t seem all that complicated, really… Aargh! I am unmoored. I don’t know what to do nor what I’m doing. The approach I was taking in constructing my own SQS function back in the day was quite a bit different, passing the full database back and forth between functions; Alroy’s approach of just passing an array of counts seems much more efficient, probably uses way less memory and is consequently faster? Although I do lose the ability to track actual taxon names. Maybe a combination of the two would be the way to do it—instead of the full database, have the function operate on a list of names?
Started by calculating Good’s U (by the original, simple formulation) for 2-myr time bins. There is very little variation in coverage estimated in this way. Correcting for this is going to do nothing for the diversity curve:
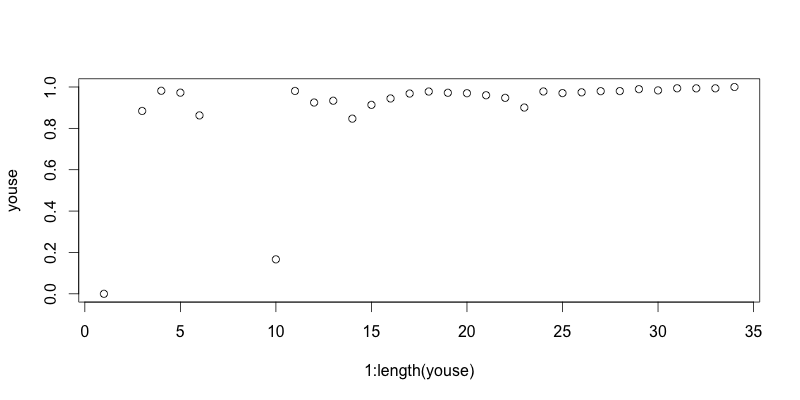
This is kind of an important plot, because it shows that implementing the SQS, at least in the simplest way, isn’t going to do anything to correct the diatom diversity curve from Neptune. I think I know why that is, too. Good’s U is measuring how well the standing diversity of a time interval is captured in the fossil record by looking for how many singletons there are, i.e. how many taxa only show up once. The greater the proportion of singletons, the more likely you’re still missing a lot of the standing diversity. Here’s the big but, though: basically all of the Neptune data is collected in m*n taxonomic charts where the m rows represent m slides prepared from borehole samples at m depth intervals, which the poor shipboard paleontologist scans through to check for the presence/absence or abundance of n different taxa. [This is the model of data collection that Dave Lazarus talks about in that recently published paper I reviewed for him at such great length last year.] This method makes it very unlikely to have singletons. I think that’s why the Good’s U values are all so high in the plot above.
The numbers would probably go down a bit if Alroy’s correction for dominant taxa were applied—i.e., take out the most abundant species, but that doesn’t really address the problem of the data collection method being strongly biased against singletons.
What if there were another method to estimate coverage, not as vulnerable as Good’s U to the bias from the Neptune-esque method of data collection? What would that look like? I suppose it could look at how many taxa show up in only one borehole, since that’s sort of the equivalent of an ‘occurrence’ of a macrofossil taxon in PBDB. That would probably work quite well for the most recent time bins, where there are dozens of boreholes, but most of the Paleogene time bins have only a couple of boreholes at most, and so many would have a very, very low coverage by that measure (I think). It might be worth a try, I suppose.
Grrr. This is not helping me make progress with the morphospace. I feel like I’m disappearing down a rabbit hole of distractions and unforeseen complications again. What I need is to get this paper done. I need to get my figures together, so that I can get the chapter written. So that I can move on. This is what I need to keep my mind focused on. I thought it would be straightforward to add diversity subsampling to the analysis of morphospace, but maybe it’s just too difficult. Maybe there are just too many complications with implementing SQ subsampling for this sort of data to apply it “straight out of the box”, as had been the plan all along. Well, fuck.
Maybe I just need to refocus on something else for a little while to let the frustration subside, because I’m pretty well boiling with frustration and rage right now. I also need to re-run the stacked 3D morphospace plot for my new cull of data so that I can plop that into my LaTeX document. Might be just the thing to do right now.


