Category Archives: Uncategorized

DPSI Final Presentations

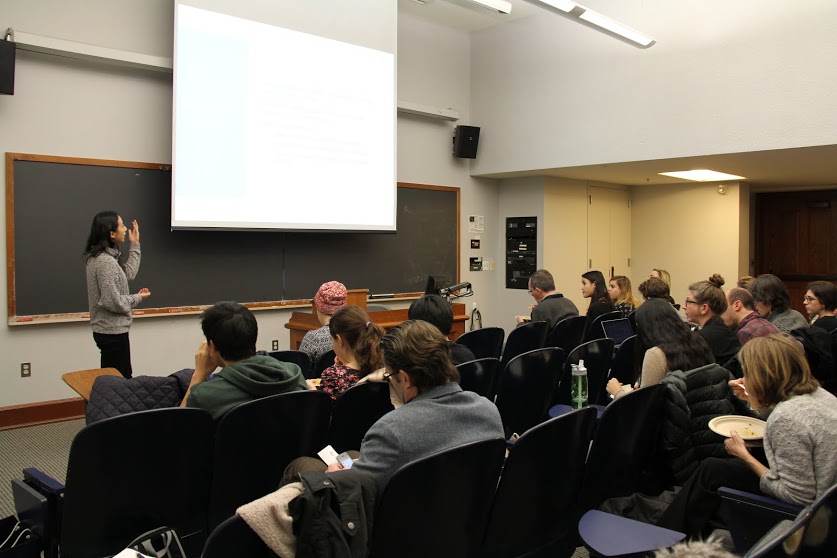
On Thursday, December 4, members of the Digital Problem-Solving Initiative (DPSI) community gathered to hear from members of the seven DPSI teams. DPSI teams feature a diverse group of learners (students, faculty, fellows, and staff) working on projects addressing problems and opportunities across the university. DPSI participants have had the novel opportunity to enhance and cultivate competency in various digital literacies as teams engage with research, design, and policy relating to the digital world.

Each team had 5 minutes to present and 5 minutes of feedback from the DPSI community audience.

Farmer’s Market: Building A Self-Sustaining Harvard Farmer’s Market
Mentor: Margiana Peterson-Rockney (Food Literacy Project)

Farmer's Market
Farmer’s Market

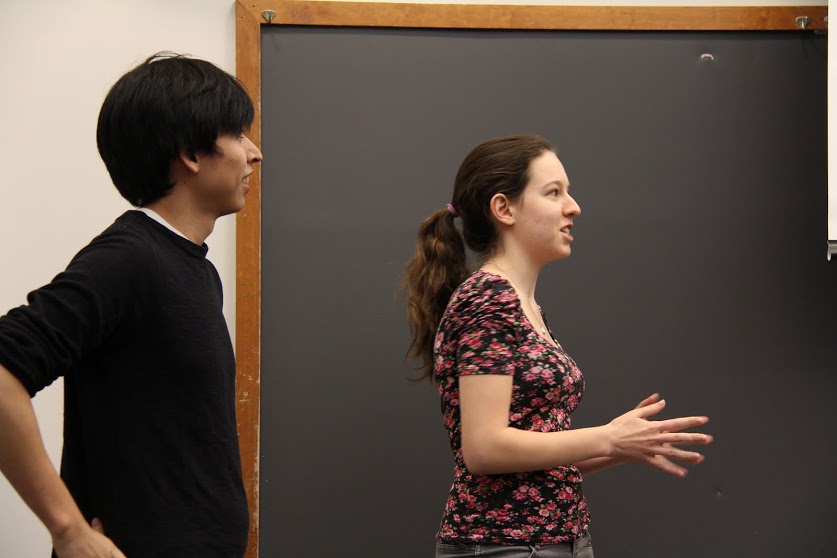
Cindy, the representative of the Farmer’s Market team, talked about how the team has honed its vision for their goals and future endeavors. They talked with the director of Harvard’s dining services to figure out another way to fulfill their original farmer’s market goals now that the farmer’s market is closed for the winter. The plan is to work with Food for Free, a non-profit that redistributes food from Harvard dining halls to places of need. In the Spring, the team will be evaluating and optimizing Food for Free’s operational model.

Farmer’s Market Blog Page

AccessEd: Accessibility in Online Education
Mentors: Chris Bavitz and Kira Hessekiel (Berkman Center for Internet and Society, Cyberlaw Clinic)

AccessEd
AccessEd

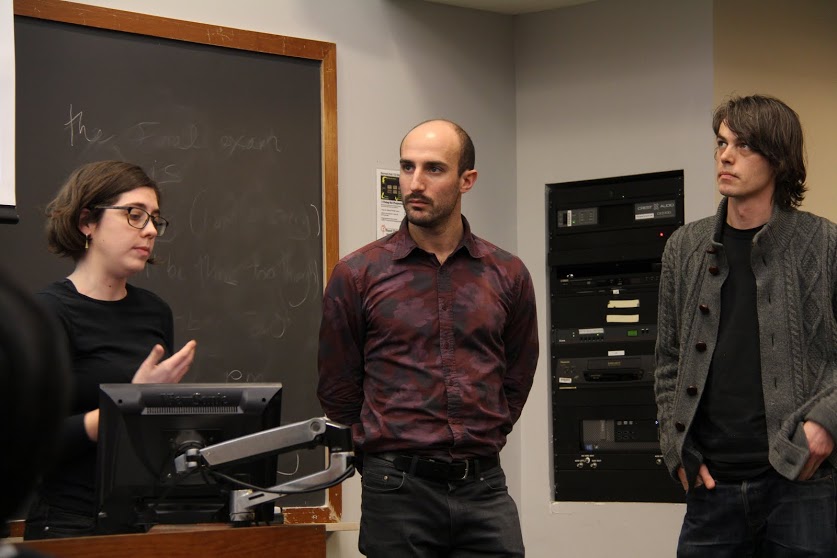
The AccessEd team talked about meeting with central individuals in the Harvard Office of Disability Services, the director of HarvardX, and the representative of a major technology vendor in the hopes of increasing accessibility in education. They’ve come to the conclusion that Harvard’s policies regarding accessibility are decentralized across schools, varying across the Business School, Kennedy School, Law School, and other Harvard schools. While cost is a major issue with any technological fix, the team hopes to increase awareness about accessibility in online education. They pointed out that there is a distinction between retroactively fitting existing courses and tools for those with disabilities and designing them from the beginning with these features in mind.

AccessEd’s Blog Page

Big Data
Mentor: Jim Waldo (Chief Technical Officer, Harvard University )

Big Data
Big Data

Big Data talked about k-anonymization and statistical bias in application to the idea that anonymizing data sets changes their behavior. They ultimately want to figure out if it is possible to anonymize data in a way that preserves privacy and data integrity. Using data from five different HarvardX courses, they assessed the nature of the anonymized versus original data sets. While they have yet to figure out a statistical fix for the issue, they suggest that perhaps we can develop a new notion of what privacy means if we do not figure out the inherent statistical properties.

Big Data’s Blog Page

eyeData: Data Visualization and Exploratory Tools Applied to Real-World Research Data
Mentor: Mercé Crosas  and Vito D’Orazio (Institute for Quantitative Social Science)

eyeData
eyeData

eyeData’s team included several coders who have been able to create visualizations of IQSS-Dataverse data. They’ve developed a website using Django and Jenkins, incorporating visualizations made using d3 of data processed using Panda. Their future work will involve further use of the Dataverse API and the addition of graphs and maps.

eyeData’s Blog Page

#DocShop: Interactive Documentary Workshop
Mentors: Matthew Battles, Cris Magliozi, and Jessica Yurkofsky (metaLAB)

#DocShop
#DocShop

#DocShop team members continued talking about their year-long trajectory for uncovering a definition for interactive documentary film making and figuring out how to shift from audiences and spectators to actors. The group talked about their upcoming event at the Graduate School of Design featuring a location based documentary based on a trip to Lawrence, Massachusetts. They likened the experience of working with interactive documentary to film’s development in the 1920’s, suggesting that “there are no rules.”

#DocShop’s Blog Page

Safe Campus: Dealing With Sexual Assault on Campus
Mentors: Diane Rosenfeld and Anisha Gopi (Harvard Law School)

Safe Campus
Safe Campus

Members of the Safe Campus team talked about their app development, titled Bonobo. The basic framework for the app is that it creates a social network for helping individuals respond to urgent situations. In contrast to existing apps, their app is geared toward existing college students. In the future they hope to talk to sexual assault support groups on campus as well as certain social organizations to gauge what types of features would be well received by college students themselves.

Safe Campus’ Blog Page

OA2014: Open Access
Mentors: Peter Suber and Colin Lukens (Office of Scholarly Communication)

Open Access
Open Access

OA2014 has been working to figure out what the best nudge would be to get faculty to deposit their published materials. Since team members come from the Kennedy School, Graduate School of Design, and Business School (the schools that interestingly have the lowest usage of Harvard’s open access repository), the team members are focused on in-context immersion to see what would make faculty there most likely to deposit research papers into the open access repository. There is also the thought of spreading awareness to student researchers to deposit into the repository, which may then inform their mentors and faculty advisors to do the same.

OA2014’s Blog Page

The evening ended with a 20 minute breakout session where teams could mingle and offer insight into ideas and methods for future work. Keep up to date with DPSI team progress on the blog, and be sure to keep an eye out for how to get involved with DPSI next semester!

Check out slides from each group’s presentation here: [dpsi] Fall Slide Deck

Wrapping Up

Our prototype is done! You can view it here. There’s only basic functionality currently: you can select one of three datasets, select a variable from it, and it fits the parameters (less than 15 elements), it will generate a bar plot. It may seem a bit underwhelming, but a lot of time, effort, and learning went into this, and we’re proud of the result. More importantly, we’ve set up the framework to develop and extend the functionality and types of graphs covered. It took us a lot of time to set up Django, Jenkins, etc., and now that that is all done, it will be much easier for later generations to develop.


Regarding possible next steps, perhaps one of the most important features will be to connect with the new Dataverse API so you can actually search for datasets in the repository. Also important will be to write scripts to generate graphs for variables that don’t fit our parameters, such as density plots or time series. Functionality should extend to include maps and scatter plots. There’s also a lot to be done with the GUI and visual presentation. We still need to add axes to the graphs, and polish the UI to look sleek and appealing. And, of course, there are still some bugs to clean up.


Overall, our experience with DPSI was very rewarding! All of us got the experience we were looking for, whether it was with data visualizations, data processing, UI, or even just working in a team. We want to give special thanks to Phil Durbin and Raman Prasad from IQSS who were a massive help in getting to where we are, as well as our mentors Vito D’Orazio and Merce Crosas. We couldn’t have done it without you!

Farmer’s Market update: Now Food for Free!

This was a difficult semester of navigating through problems the team could solve, and aligning that back to our interests. Disengagement grew until I was the only one left active on the project.

I met with the Director of Dining Services, who enlightened me to a few things. One: Harvard Farmer’s Market was a community investment. Two: in the grand scheme of things, the investment made to the Farmer’s Market is so minimal that reaching financial sustainability is not a priority. Three: there are other organizations, however, that could benefit from being cost effective.

The Director introduced me to a partnering non-profit organization, Food for Free. Food for Free re-distributes leftover food from the Dining Halls to places of need. Their services are at no cost to the suppliers or benefactors, so they have to operate in a lean fashion.

I am grateful for the change in direction. This will likely transform into a Spring semester project, where we will be recruiting for a new team. Please send any interests our way!

Cindy

#DocShop meeting 10

What we worked on This week we met  in Gund 522 to start figuring out the exact ‘stations’ that will be part of the spatialization of Lara’s Tahrir Square archive. We also talked about various data visualizations and tools (such as Gephi, Roundware, and BackStory) we will utilize in the buildout of this prototype for DocShop’s pilot event. We have one or two venues we are deciding between and we are looking at the evening of Thursday December 11th as a launch date. Here are some process documents/photos from today: Tahrir_map_3sld1xhk   2014-11-23 20.51.22 2014-11-23 16.44.36       2014-11-23 17.21.25   2014-11-23 15.13.53 2014-11-23 14.34.15


What went well

Dividing aspects of the archive into different ‘stations’ and dividing up tasks and ownership. The tasks include PR and outreach, media, event planning, physical layout, printing, and documentation.

What was challenging

Narrowing down the scale of this project to something attainable within two weeks while being faithful to the ideal form this embodiment of the archive will take.

What’s up next

We will meet twice in the week following Thanksgiving. Once in Gund 522 for a working meeting, and once in the space where we will be projecting/performing the archive to start blocking out the stations and media in real space.

Keep on Trucking

Hi everyone,


First, props to anyone who has stuck with our adventure thus far. We appreciate the readership!


This week, some of the mentors were out of town, so instead of a discussion meeting, we had a work session. We were successful this week with developing an understanding of how our various parts integrate together: the UI has to allow users to select variables, which tells the data manipulation module what to select, which is passed to the visualizing function which passes the graph to the UI… It requires a lot of prior coordinating and planning, so that’s part of what we focused on this week.


What has been challenging is navigating the Django framework and understanding where  the various functions that we write belong. Some of us are new to it, so we’re trying to grasp what’s going on when it loads the page and how we fit into it. Shouldn’t be too challenging, though!


With the final presentation coming in less than a month, all our efforts are focusing on cleaning up the UI and generating the visualization. It’s gonna be great!


Best,

Alex

eyeData update

This week we focused on finalizing our plans for the visualizations and finalizing which team members will contribute each part. We spent a lot of time discussing the pros and cons of d3 and Vincent, a module that allows for easy Vega visualizations of python data. We ultimately decided that d3 would be the better choice, because it gives us more options and greater flexibility with our graphs. It also allows for easier expansion of our product if we so desire. We also spoke about how we would analyze the data to determine what sort of graph to automate for each data set, and how we would output our analysis for easy use in JavaScript. We decided that outputting the most useful information in json would make our d3 visualization as efficient as possible.

We made a lot of progress on determining our overall structure and making sure that we are on a good path to finish by the time of the final presentations. What was challenging about this weeks meeting was making sure that all the parts of what we are doing and how those parts will fit together were clarified for everyone, as our product has so many components.

For the next meeting, we plan to have working visualizations and analyses of sample data files. We will spend the next meeting discussing how to improve and/or expand these visualizations in order to make our product as useful as possible.

Open Access – Team Update

Midterm review/ What we did
The midterm review was productive in introducing various topics of discussions for our team to move forward with the Open Access project. Through the suggestions of the various groups, the Open Access team is working on the DASH opinions from various Harvard departments, and analyzing the data we are receiving to move forward on a method to best attack the next steps of instating the Open Access project.

What went well
Our team learnt that a possible solution on getting faculty members with published materials to participate within the program is to communicate with their assistants, and work with an online system that enables faculty members to submit their published papers through a departmental electronic system. A similar system is being used at the Berkman Center for fellows and scholars, whereby it is required before an article is submitted for review, that there is an online check-box system for scholars to tick off, and agree to their rights of file to be reviewed and submitted to the DASH system.

Another suggestion was to contact and develop relationships with publishing houses, who would like to cooperate with the DASH system and move forward with donating their published papers within the DASH system. Whereby the open access team could monitor and bring access to the Harvard University community.

What was challenging
The challenge that we foresee is for a 80% or more implementation rate of open access throughout the University level. As most publishing houses would like for their publications to be in closed rights. We are also foreseeing difficulties with faculty members remembering to submit their papers to the DASH system, and/or ensuring their participation within the check-box system.

What’s up next
Several members of the open access team are still in the stage of survey within their respective departments, and will be offering other suggestions and comments soon after they receive more feedback.

Updated: 4 November 2014 – Wendy W Fok

AccessED Update

 
After our mid-term review, we definitely knew we wanted to meet with MOOC developers and get their insights on accessibility. We are trading emails with some great people and trying to set up a time! It’s a bit of a challenge to juggle people’s schedules, but hopefully we’ll get find a time soon!

Farmer’s Market: Shifting gears

At the mid-term review, we shared our struggles of finding project alignment with the larger group. After the warm response we received, we forged on with figuring out what we want to accomplish this semester.

Among the group, we’ve confirmed there is a strong interest in understanding the local food community, which our current mentor is knowledgeable on. We are also meeting with Crista Martin, director of Dining Services, for insights on longer-term objectives of Farmer’s Market. Hopefully, this will guide us in a new direction.

There is still work to be done in terms of team engagement as well. But maybe redefining the purpose will work in tandem with improving team dynamics.

Sincerely,
Cindy, Christian, Niousha

eyeData – In the Trenches

What We Did

This week, we continued to work on the actual coding. Unfortunately, due to some tight schedules and external factors, we weren’t able to meet. We also have some design considerations to resolve before we can continue to move forward with the coding, described below.

What Went Well

Despite not being able to meet, what did go well was our communication outside of the meeting. Batsheva, Luis, and I continued our dialogue on language and technology choice. As this project will require a lot of collaboration between each of our three parts, it’s reassuring to know that progress can and will be made outside the meeting.

What Was Challenging

The main challenge this week was deciding whether to continue to use the d3.js library or shift to Vincent, a Python library built on top of d3.js. Since we are using Pandas, a Python library for data processing, it makes intuitive sense to use Vincent, but it is another package to learn, which takes a nontrivial amount of time to familiarize with.

What’s Up Next

We continue to make progress with the code! By next week, we hope to be able to select a variable from a dataset and create univariate graphs for that variable. We also should move to using the Dataverse API to grab datasets and continue polishing the UI.


Until next week,

Alex