IE*: More on job losses in the Inland Empire

According to a report [pdf] from the California Employee Development Department, the Inland Empire since 1984 has created an average of 32,208 new jobs per year.  The highest year of job creation, 2005, saw 62,663 new jobs in the region.

But, as I’ve noted, the current jobs situation in IE is dire, with unemployment at 9.1% and forecast to rise above 12%.  Here’s some more color behind those unemployment rates:

The IE has lost a net total of 19,700 for the year to date, the first time since at least 1984.  Disregarding job creation, a total of 31,000 jobs have been lost, nearly all (an estimated 95%, according to John Husing*) tied to construction.

The collapse has been swift and severe.  As I’ve discussed before, the IE has low educational attainment rates.  Given that fact, blue collar jobs, notably construction, are especially important here.

Share of Adults, No College Class

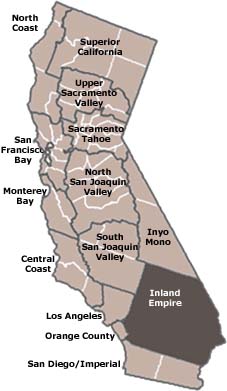
Southern California Counties, People 25 & Over, 2006**

San Bernardino. 52%
Riverside 51%
Los Angele 48%
Orange 37%
San Diego 36%

~

According to Grubb & Ellis, the region still accounts for four fifths of the entire southern California industrial construction market.  But there are lots of empty office, warehouse, and light industrial buildings all around — I can think of several city blocks of newly built industrial buildings that are sitting empty in Redlands at the moment.  That construction market, in other words, will continue to slow with the attendant effects on employment.

* Of Economics & Politics, Inc. The data here comes from a presentation entitled “Inland Empire 2008 : A Very Difficult Year!” [ppt].

** 2006 American Community Survey via Economics & Politics, Inc.

IE6: Election results

Presidential election

Obama McCain
San Bernardino 51.6% 46.5%
Riverside 50.8% 47.6%
California 60.9% 37.3%

I was surprised that the Inland Empire vote went to Obama; this feels like a very red part of a very blue state.

Proposition 8

Yes No
San Bernardino 67.1% 32.9%
Riverside 64.3% 35.7%
California 52.3% 47.7%

Prop 8, to ban gay marriages was by far the most controversial item on the ballot; we had two Non on 8 signs stolen from our front lawn, although our Obama-Biden signs weren’t touched.  The disproportionately strong Yes (anti-gay) vote in the Inland Empire helped the measure pass in the state as a whole.

Voter Turnout

San Bernardino 57.2%
Riverside 50.1%
California 65.2%

The low voter turnout is a surprise to me; and why Riverside so much lower than San Bernardino?

[source: California Secretary of State]

IE5: Unemployment

Augie's in an LA Times photo set

From an economic conference sponsored by the University of Redlands:

The unemployment rate in the Inland Empire is currently 9.1%, double what it was two years ago.  It’s forecasted to reach 12.4% in two years and gradually improve from there, although the forecast, from Beacon Economics, predicts that it won’t reach its pre-recession level until 2013.

Inland Empire unemployment rates (August):

2006: 4.8%

2007: 6.1%

2008: 8.8%

(Photo of Augie’s Coffee Shop, from an odd LA Times article on Redlands.)

IE4: Real Estate Woes

Inland Empire Region MapVia the Wall Street Journal, Zillow has just published their latest real estate survey including data for the Inland Empire.  Zillow reports that home prices in the area are down 36.0% since their peak in the second quarter of 2006.  A majority, 62.1%, of homeowners in the Inland Empire who have purchased their homes in the last five years are under water — that is, they owe more than their house is worth.  Sixty five percent of homes sold in the IE in the second quarter of 2008 were sold for a loss and, amazingly, more than half of the sales were of foreclosed properties.  (The average foreclosure transaction rate for the past five years was 8%.)

Redlands home prices are down 7.7% quarter-over-quarter and down 26.1% year-over-year.

The Journal estimates that housing prices in the region need to drop an additional 24% to restore the pre-boom price/income ratio, a measure of affordability.  Clearly, there’s an imbalance in the kinds of jobs available in the region and the relative cost of housing, but I’m not sure if their measure of historical affordability (the average ratio of home prices to household income for the period 1985 – 2000) is accurate.  But here’s a real-world example of the problem:

Assume a family of four with a household income of $28,000/yr.  With the absurd mortgages on offer at the top of the market in 2006, they were able to qualify for a $410,000 loan, the annual payments for which are greater than their gross income.  They were able to pay for it with an $80,000 line of credit, taken out at the same time as their mortgage.  With their house deep under water, it’s a perfectly reasonable economic decision for them to just walk away from house.  They had expected to ride the wave of rising housing prices but they had bad timing and got caught as the wave broke.

IE 3: Key dates in the standard history of the Citrus Empire

Citrus packing house in Redlands, CA

I have referred before to my theory of the standard history, the (only partially sarcastic) idea that everything was invented between 1880 and 1910. Fortunately, the history of the Citrus Empire, what later came to be the Inland Empire, follows this pattern quite nicely:

1. Pre-history

Before 1870, you had Spanish and Mexican settlers, Native Americans, Mormon pioneers, the random Anglo gold prospector and so on.  But it’s a fuzzy, out-of-focus picture of sparse settlement in a dusty backwater.

2.  Invention

In the time of great change, here starting perhaps in 1870s, everything that we understand as foundational to the Inland Empire is laid out.  At the beginning of the period, there’s nothing.  But by the end, you have railroads linking the region with the rest of the country, irrigation to support a booming economy based around citrus, and established settlements in the form of the citrus colonies of Riverside, Pomona, Ontario, Redlands, Claremont, and so forth.  Even the stories that we commonly associate with California — especially the healthy lifestyle and the abundance of the land — were created and propagated during this time.  A rough timeline, drawn largely from Douglas Cazaux Sackman’s Orange Empire: California and the Fruits of Eden, looks like this:

1873: “Washington” navel oranges arrive in Riverside

1877: first shipment of oranges from southern California

1882: Santa Fe transcontinental railroad

1886: citrus fair in Chicago

1886: refrigerator cars on the Southern Pacific railroad introduced

1889: 452,000 boxes of citrus shipped

1893: World’s Columbian Exposition in Chicago

1898: Sunset magazine, the “in-flight magazine of the Southern Pacific Railroad” introduced

1899: 6,000,000 boxes of citrus shipped

1907: Citrus Experiment Station, which would be the University of California at Riverside, established

1909: 14,500,000 boxes of citrus shipped

3.  All the rest

The third phase, after about 1910, is really just explication; the themes, and the physical infrastructure, were in place and the growth that subsequently happened simply filled in the frame that was drawn in the previous phase.  Coincidentally, our house in Redlands was built in 1910, so I can draw an imaginary line from the family that first lived in this house down to my own, and while there have been many changes over that time, the basic patterns — the structures of everyday life — were by that date already in place, I believe.